Platform Design Specification
High-resolution UI mockups and technical specifications for frontend development
Phase Navigation
Design Resources
Lifecycle Assessment
Adizes Business Lifecycle Framework
Determines WHERE the business is in its lifecycle stage. This foundational assessment prevents wrong interventions by establishing context before any modeling or execution begins.
Full Dashboard UI
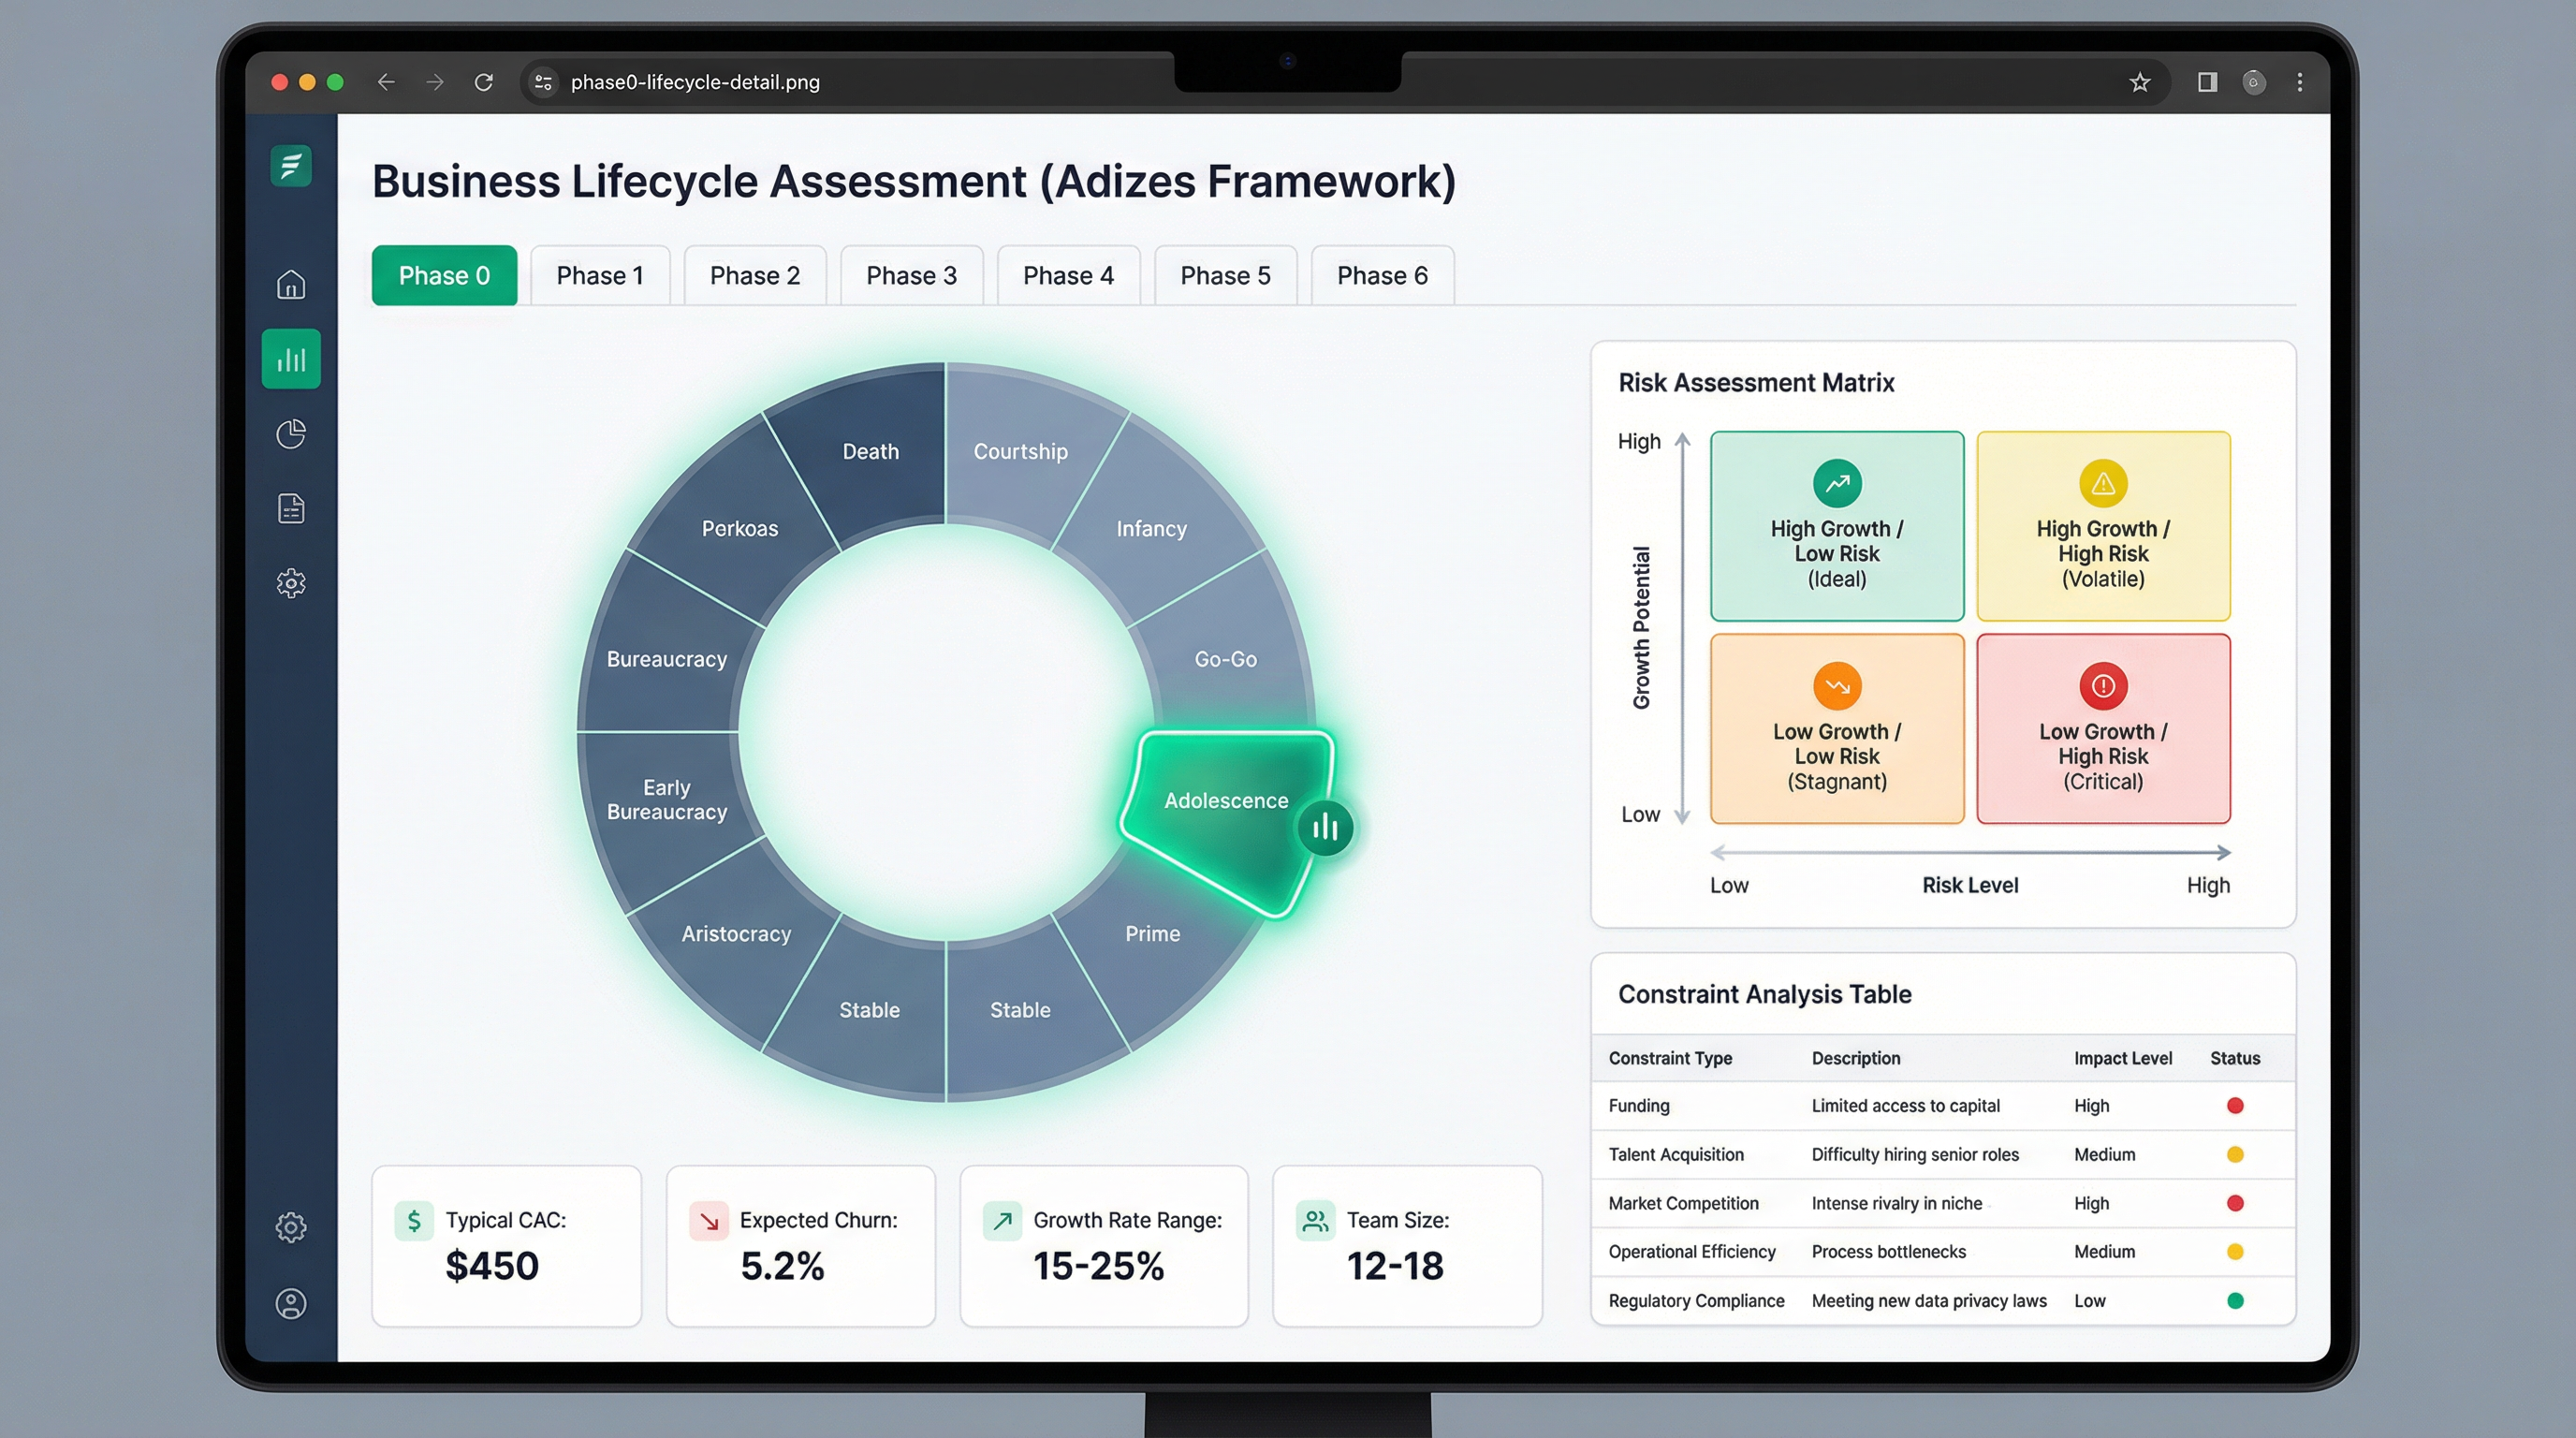
💡 Developer Note: Right-click the image above and "Open in new tab" to view full resolution (2752×1536px). Use browser zoom to inspect detailed UI components, spacing, colors, and typography.
UI Components
- Circular lifecycle stage visualizer
- Risk assessment 2x2 matrix
- Stage-specific metrics cards (CAC, Churn, Growth Rate, Team Size)
- Constraint analysis table with traffic light indicators
- Stage transition probability indicators
Key Interactions
- Click lifecycle stage to view detailed characteristics
- Hover risk quadrants to see historical data
- Toggle between current and projected lifecycle stages
- Export stage assessment report
Data Flow Architecture
Company metrics, team size, revenue, churn data
Adizes lifecycle classification algorithm
Stage determination, risk profile, recommended interventions
Technical Implementation Notes
- Circular SVG diagram with interactive segments
- Real-time data binding for metrics cards
- Color-coded constraint table with sortable columns
- Responsive layout: vertical stack on mobile
Ready to Build This Platform?
These high-resolution mockups provide the complete visual and technical specification for implementing the Predictive Growth Engineering platform.